
We build free, open tools that turn complex city data into clear insight. Our goal is to help Chicagoans understand how their city works, engage their leaders, and shape better outcomes.
Safe Streets tools
City Finance tools
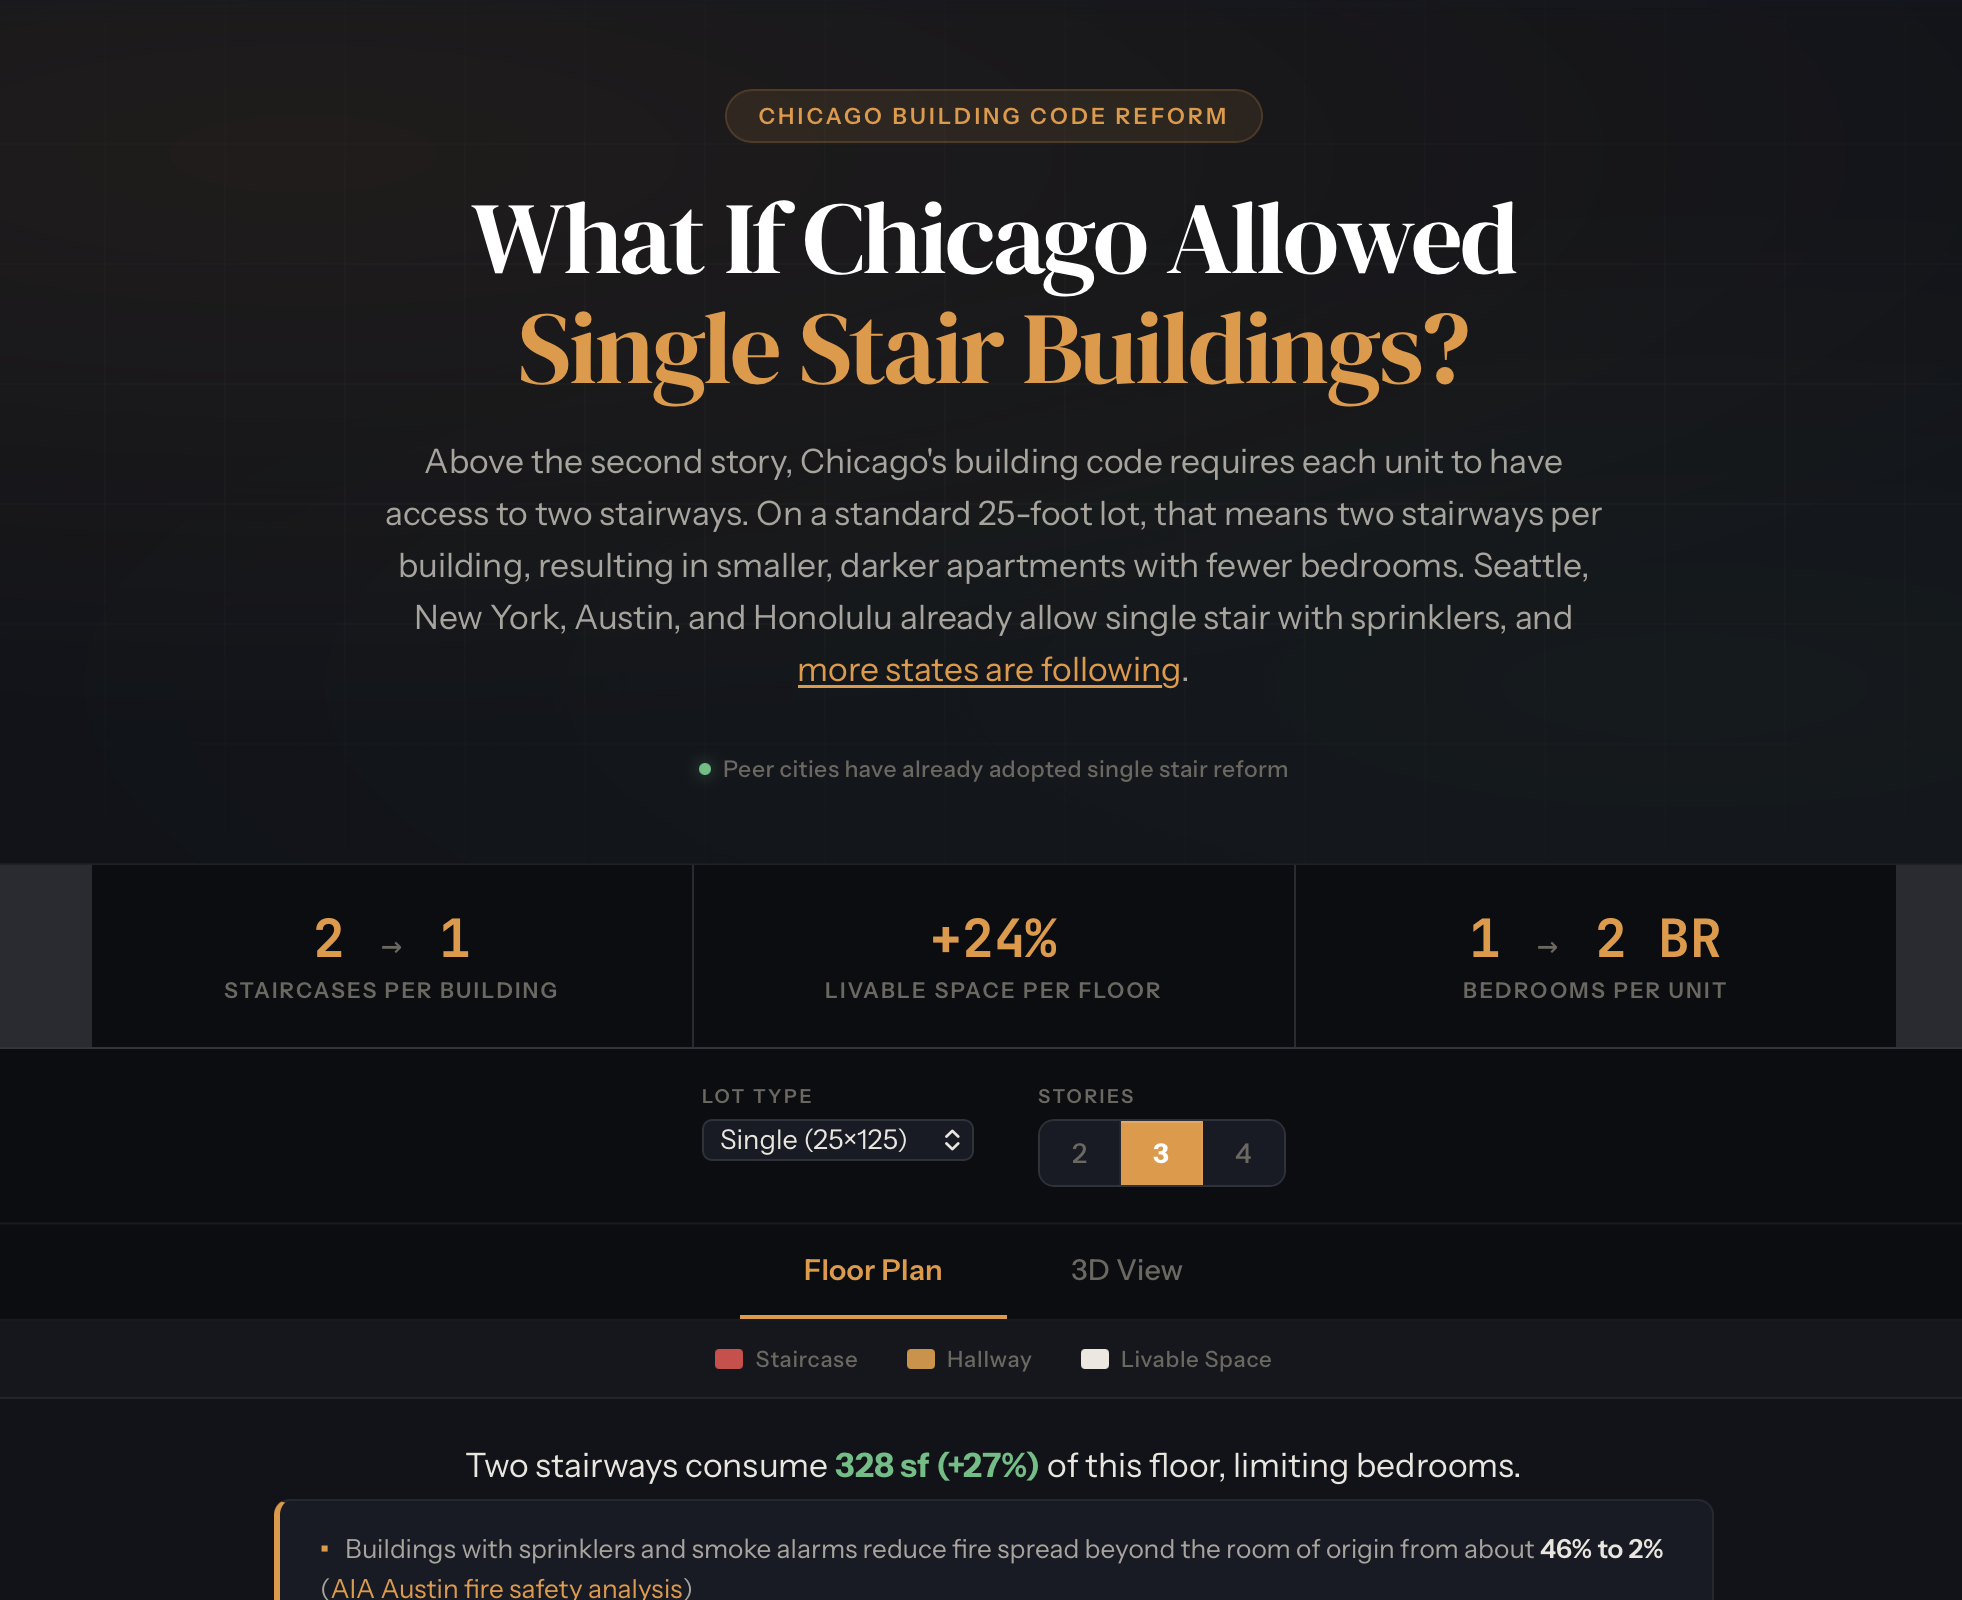
Chicago's building code currently requires multiple stairways on a standard 25-foot lot, eating up space that could be housing. This interactive 2D/3D tool shows exactly how much floor area is lost under current code versus a single-stair design. It makes an otherwise technical building-code argument instantly visual and persuasive for advocates and aldermen alike.
Chicago's 2025 ADU ordinance required aldermen to affirmatively opt their wards in to allow coach house and accessory dwelling unit construction. This dashboard tracks who has and hasn't opted in, ward by ward. It's a live accountability tool that makes it easy for residents to see exactly where to direct pressure on their alderperson.
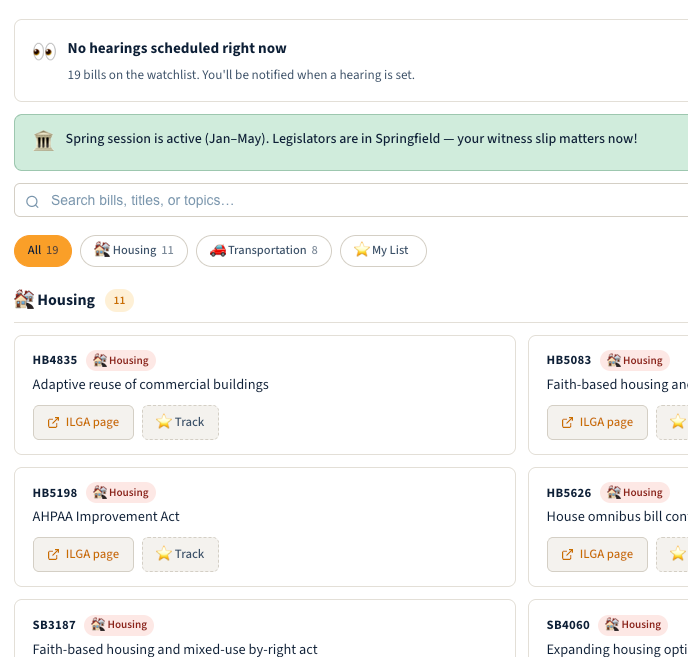
In the Illinois General Assembly, you can make your voice heard on legislation via a witness slip, which records support or opposition. Simplify the process of knowing when to file using this tool, which tracks Strong Towns Chicago priority bills.
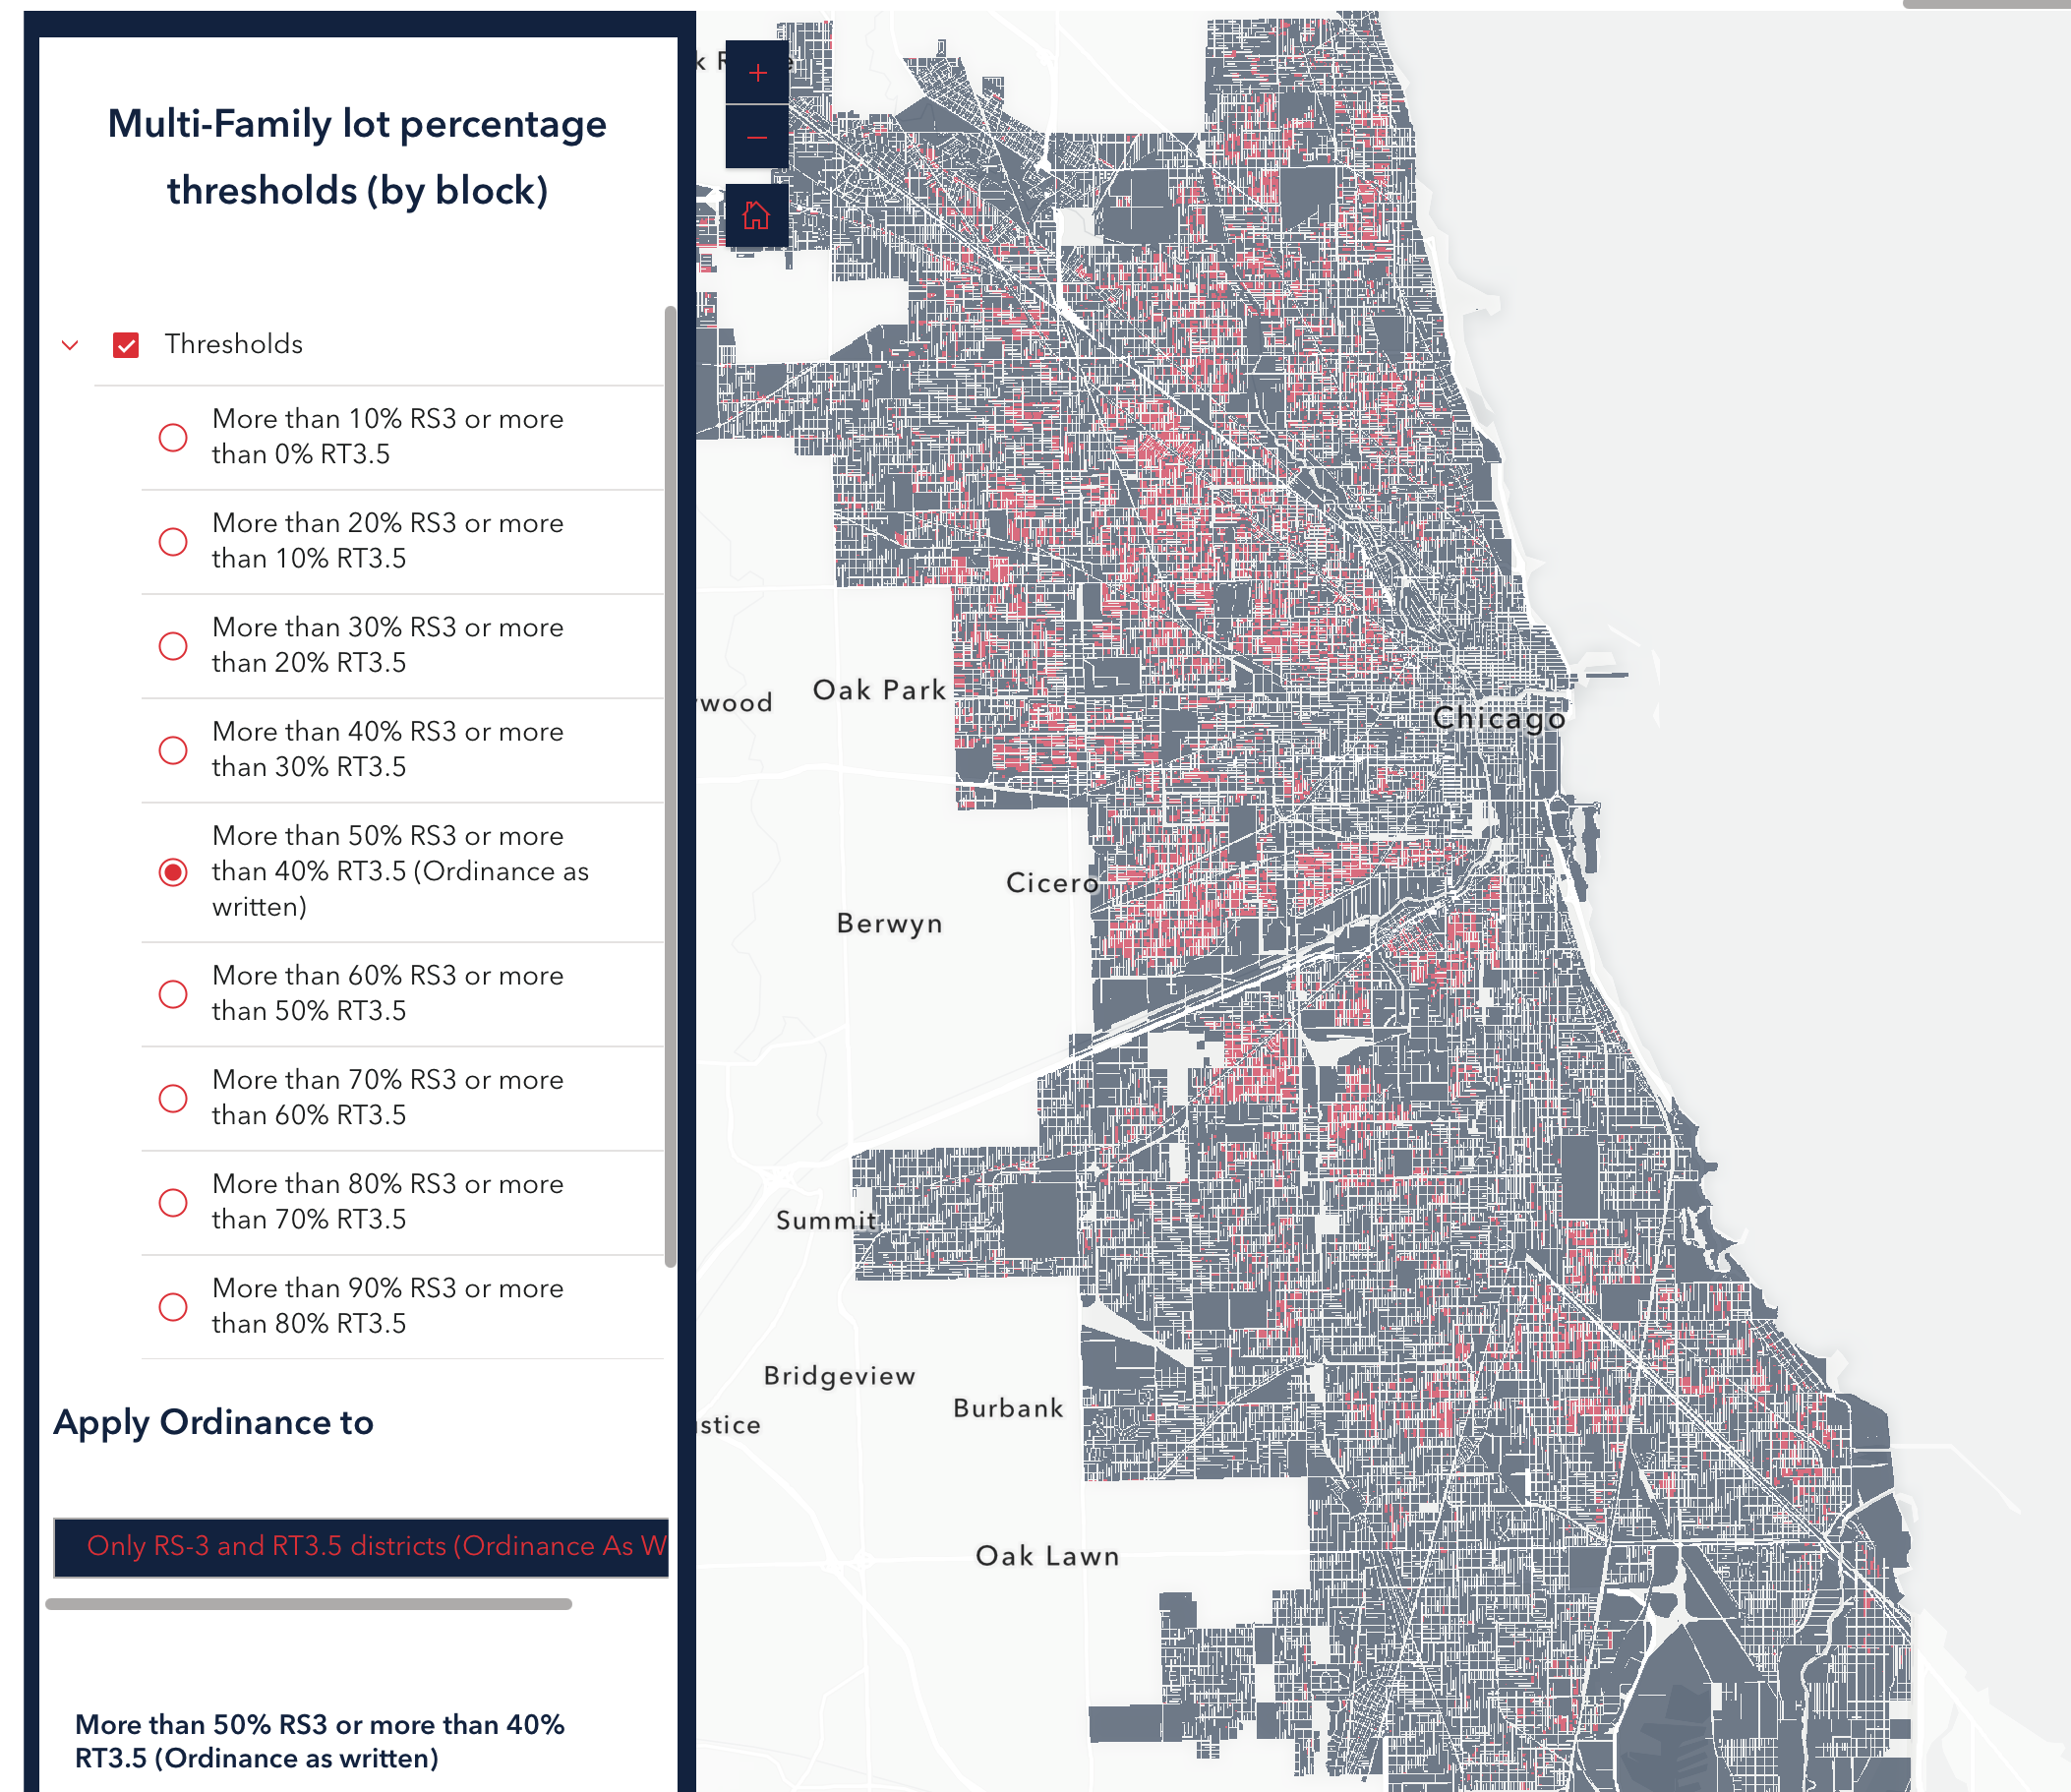
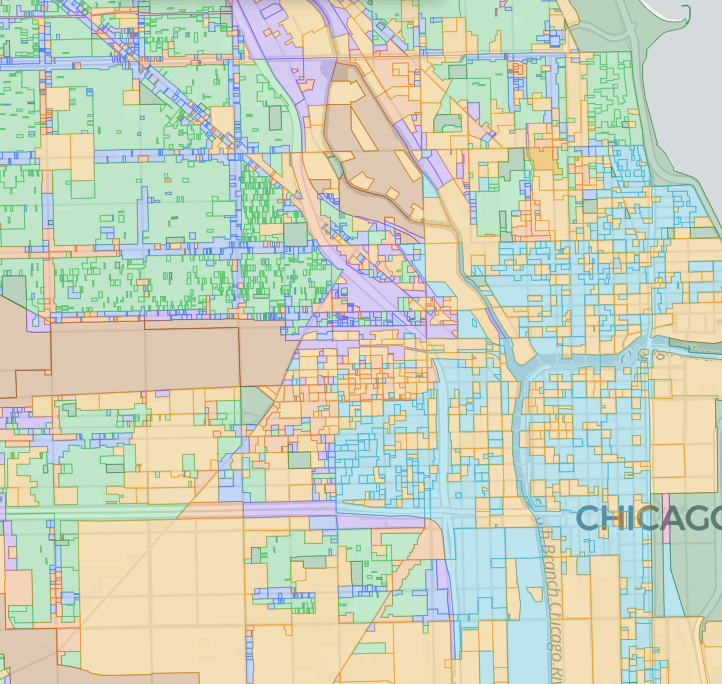
Chicago's zoning code uses a "block preponderance" rule that restricts what can be built based on the dominant existing building type on a block, often locking in low-density development even on well-located lots. This map visualizes that invisible constraint across the city, helping advocates and builders identify where the code is silently blocking more housing.
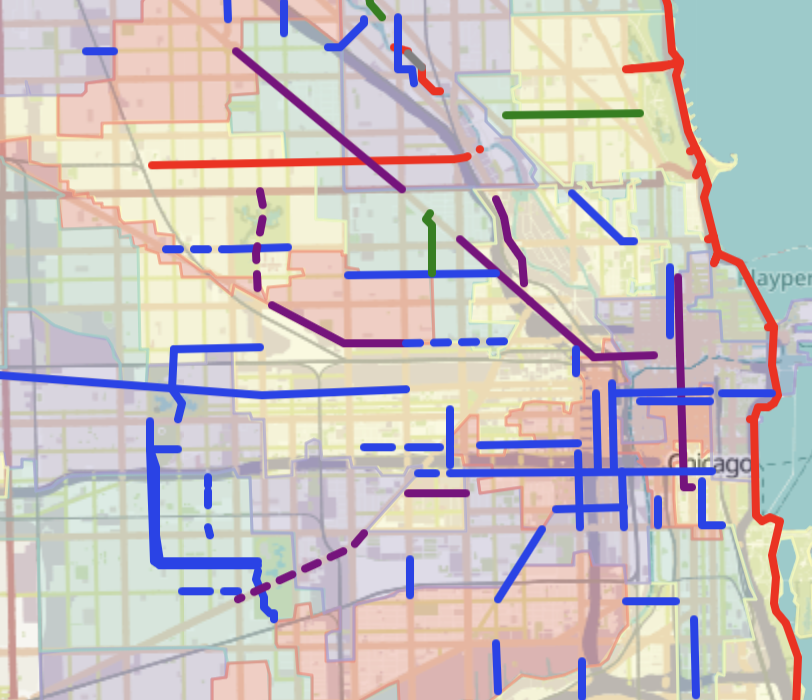
Unlike the city's official bike map, which mixes painted lines and shared lanes with genuinely protected infrastructure, this map shows only truly separated, low-stress routes. The gives cyclists an honest picture of where it's actually safe to ride. It also highlights planned future protected lanes, making it a clear advocacy tool for demanding more real protection where it's missing.
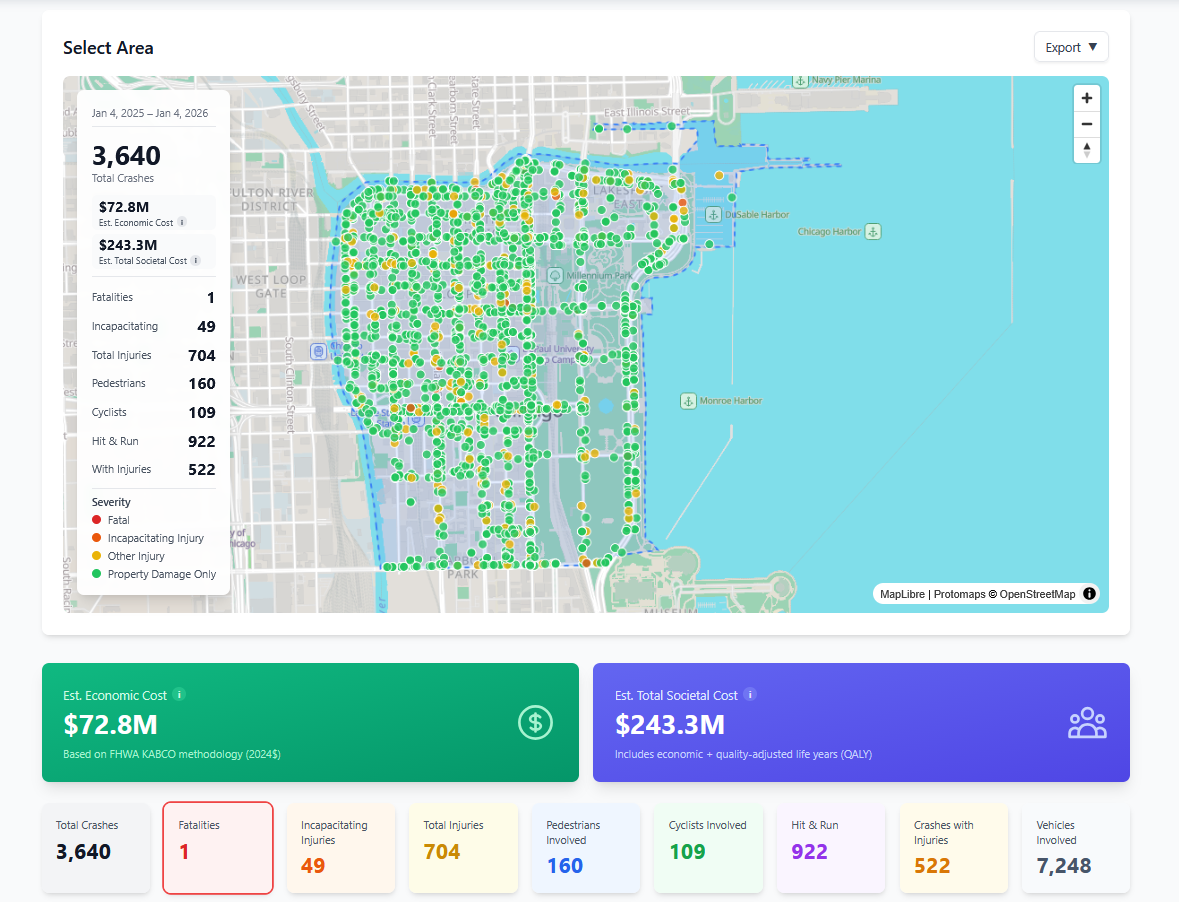
An interactive map that lets you explore traffic crash data across Chicago, surfacing dangerous intersections and patterns. Use it to identify where streets are failing people and build evidence-based arguments for safer street design in your neighborhood.
Housing tools
General tools
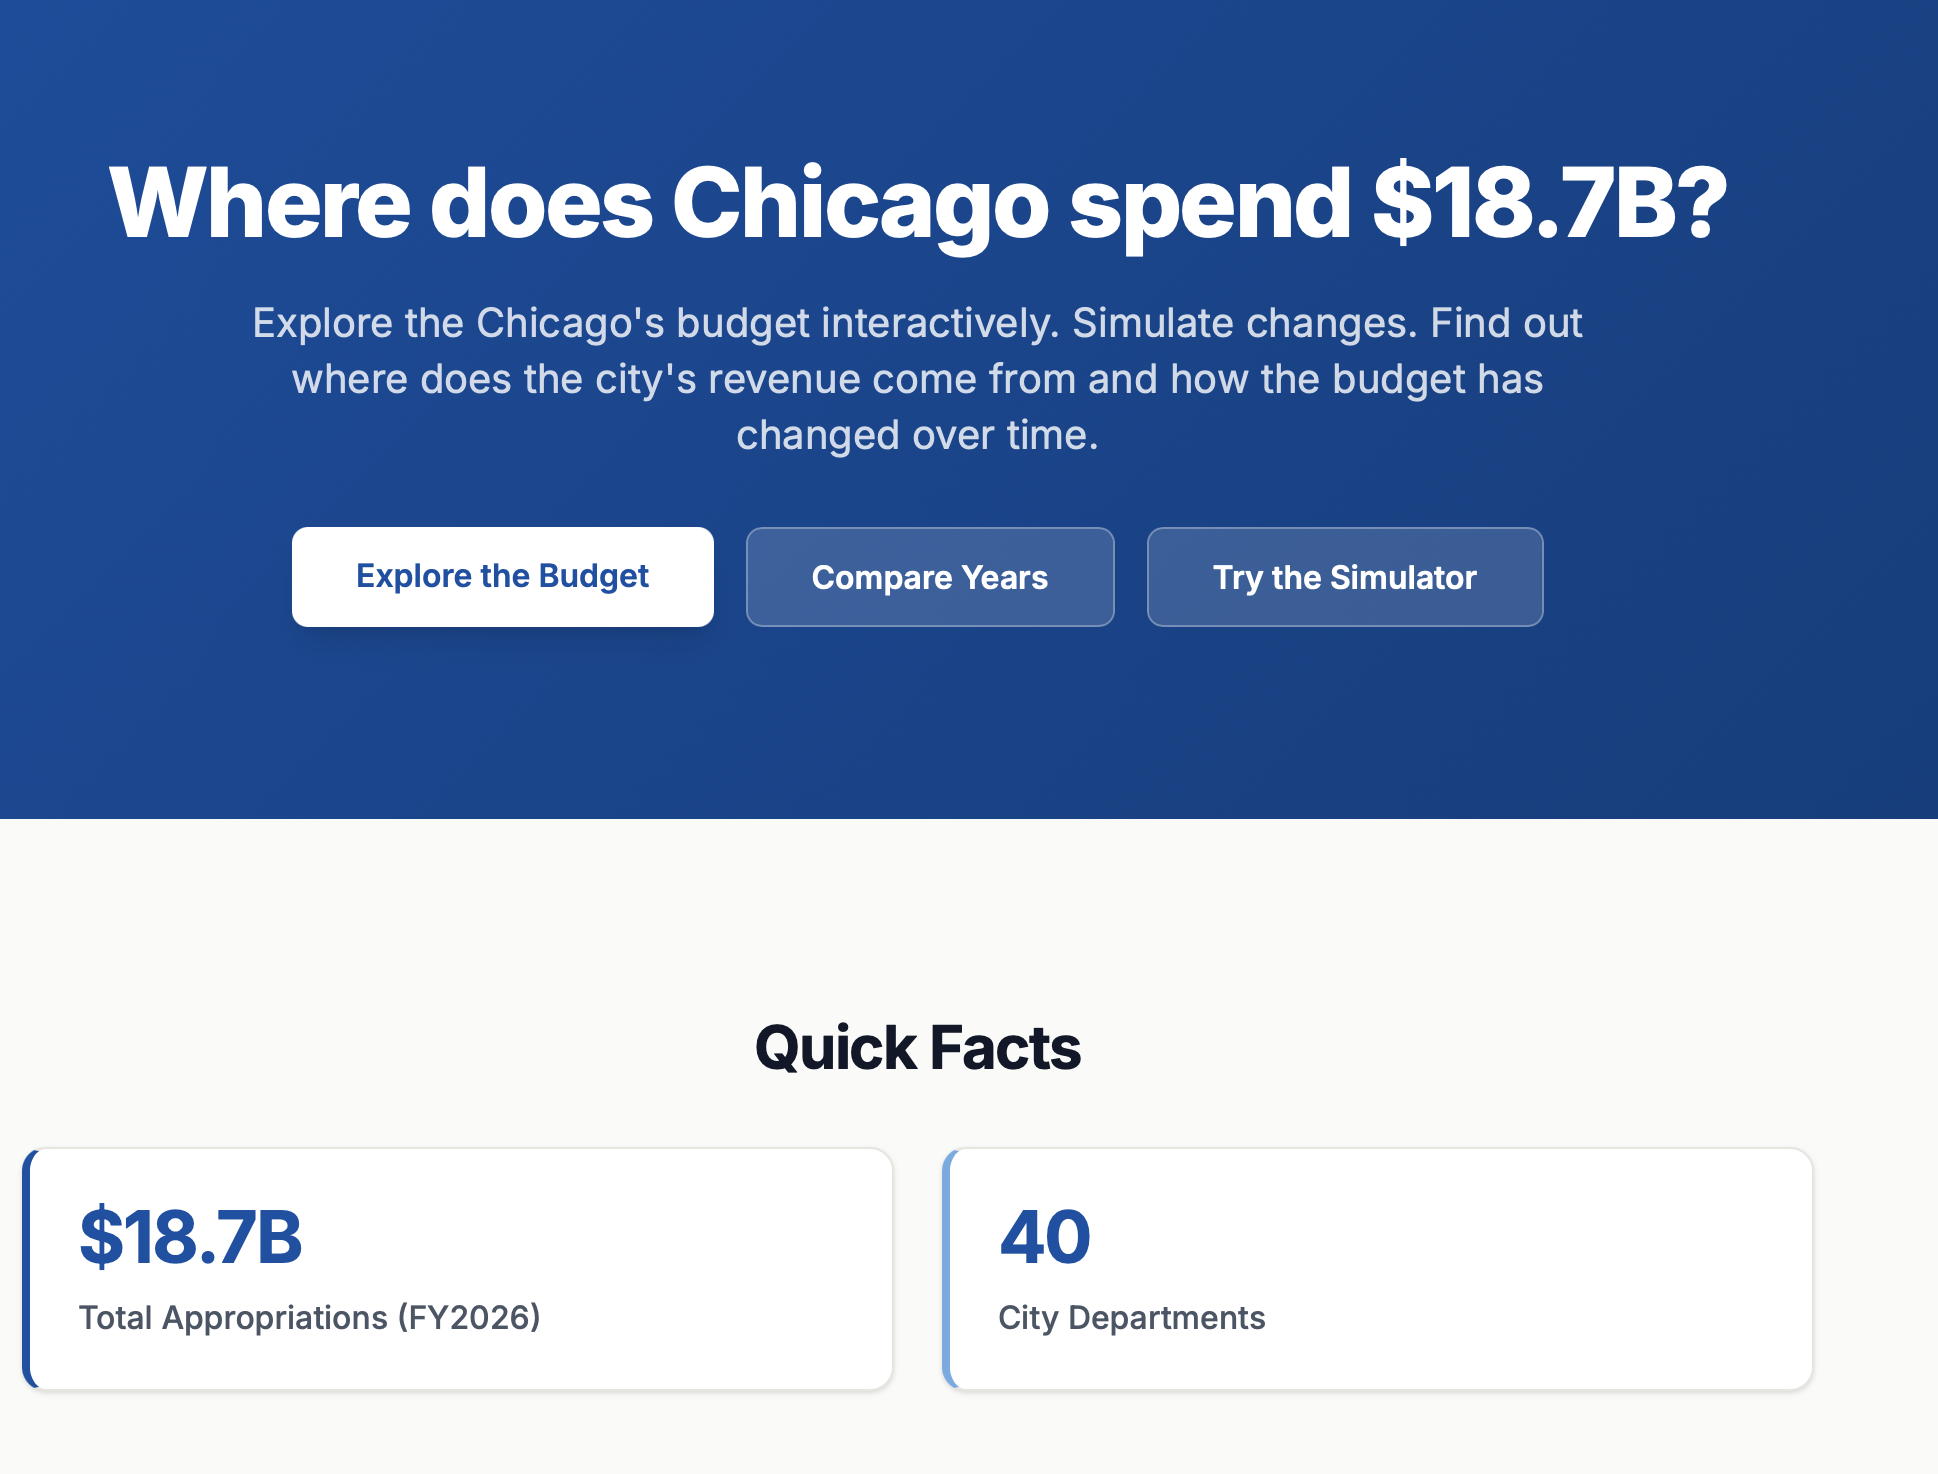
An interactive tool that breaks down Chicago's city budget by department and program, making it possible for everyday residents to understand where the money actually goes. It demystifies municipal finance so advocates can ask sharper, more specific questions about spending priorities and tradeoffs.
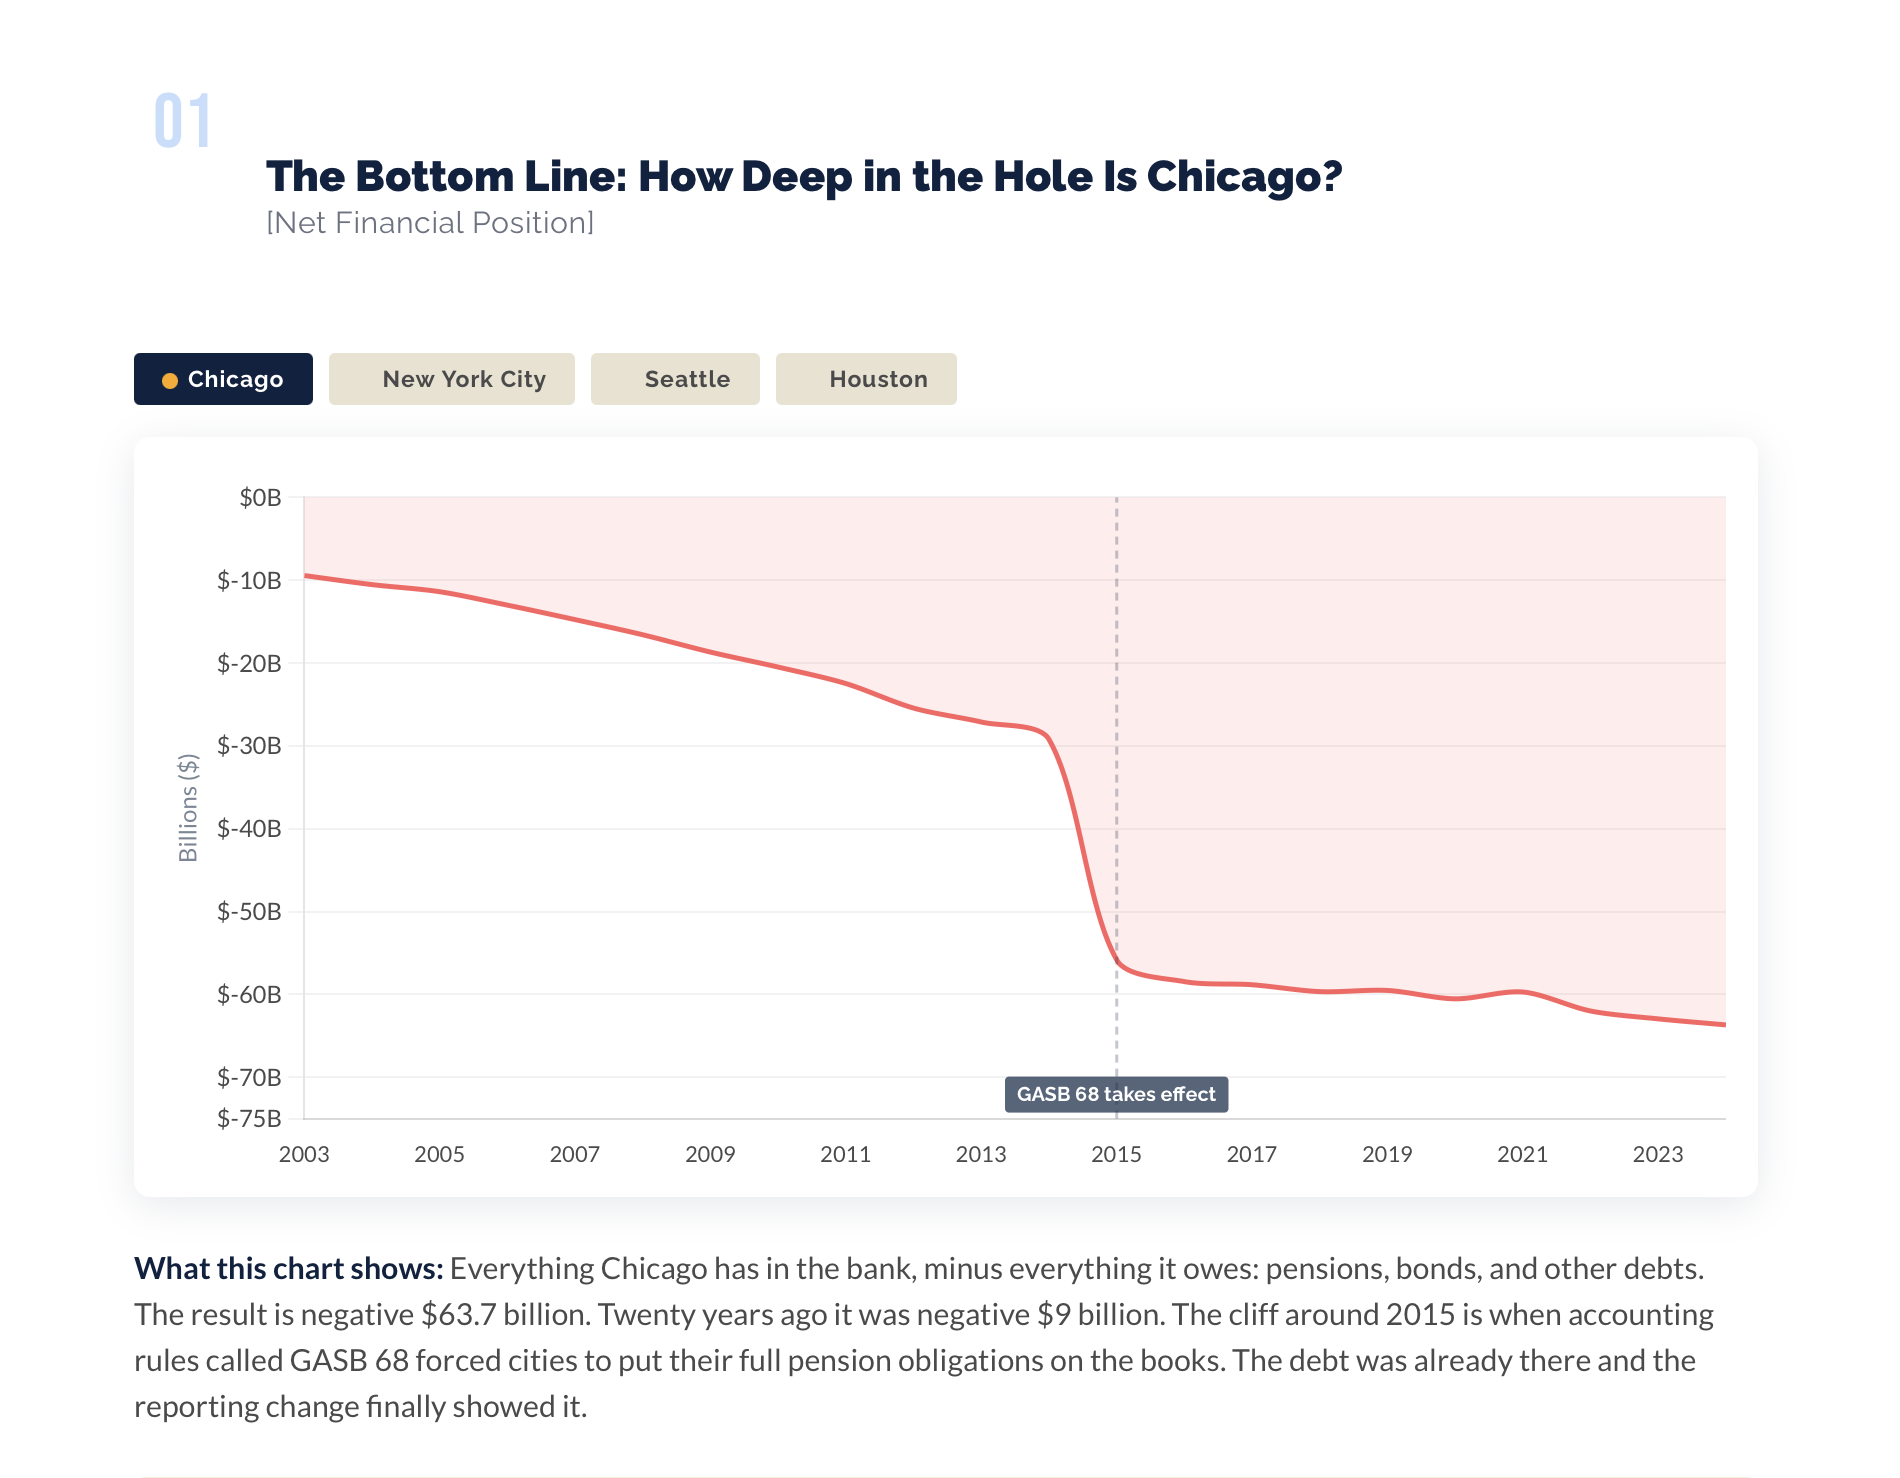
This tool charts 20+ years of Chicago's Annual Comprehensive Financial Reports into seven clear indicator charts, asking whether the city is financially sustainable, flexible, and not dangerously dependent on external funding.
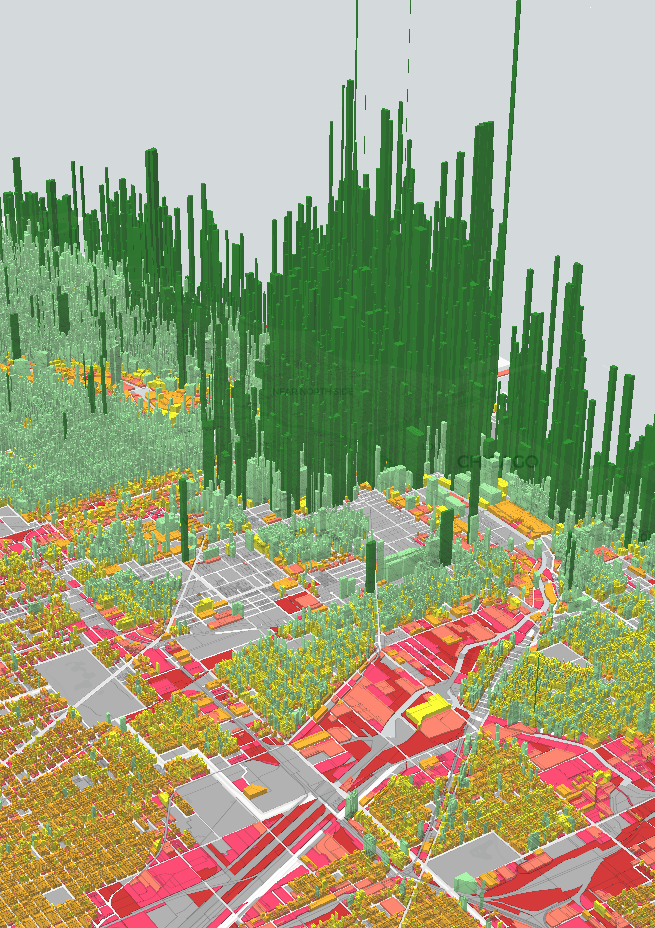
An interactive 3D map visualizing market value and property tax revenue per acre across Chicago and Cook County, making the Strong Towns core argument tangible: dense, walkable neighborhoods punch far above their weight fiscally compared to sprawling, car-dependent ones. It's one of the most effective tools for showing an alderperson why upzoning or infill housing is a financial win.
Enter a Chicago address or click the map to see what current zoning restricts and what you can do about it. Chicago's zoning code determines what can be built or opened on every block. On most residential streets, opening a daycare, small grocery, or restaurant requires a special use permit: a public hearing, certified mail to all neighbors within 250 feet, a $525 filing fee, and typically 3-4 months of waiting.
A searchable database of newsletters that Chicago's 50 aldermen send to their wards, covering topics like zoning, transit, housing, and community issues. It lets residents and advocates quickly see what their elected officials are (and aren't) communicating about the policy issues that shape their neighborhoods.
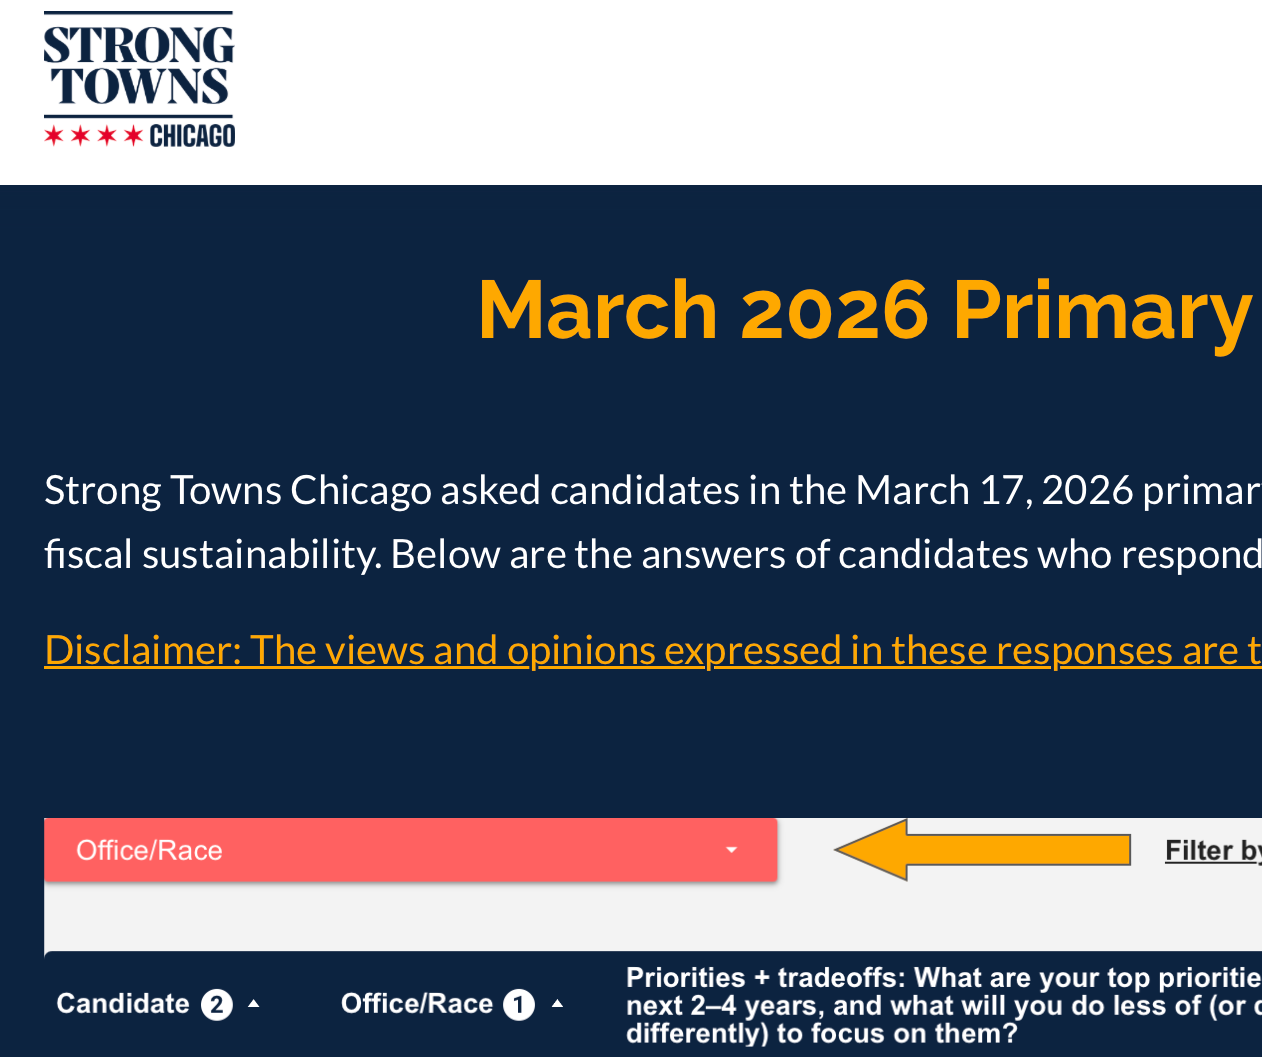
Strong Towns Chicago surveyed candidates running in the March 2026 Illinois primary on housing, transit, and street safety issues, then compiled answers side-by-side for easy comparison. It's a voter guide built around the specific urbanist policy questions that matter most to the Strong Towns community.